Sustainability Analysis 4: Strengthening rural land use governance
The NCEA launched a fourth Sustainability Analysis on strengthening rural land use governance in low and middle income countries.

25-03-2026
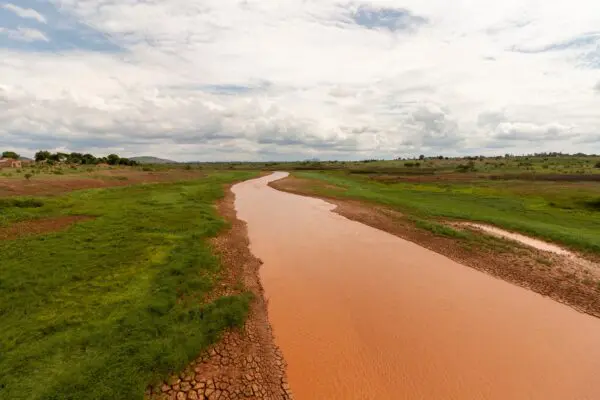
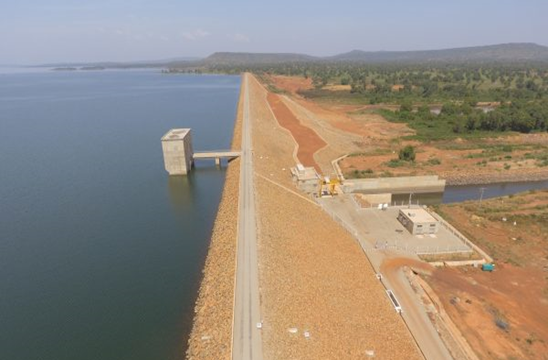
Land use planning